Comparative Fucosylation Analysis in Cetuximab and Human IgG N-glycans

October 20, 2020
Glycosylated biotherapeutics comprise nearly more than half of all the biotherapeutics. Among these, glycosylated biotherapeutics, monoclonal antibodies (mAbs) hold the majority and constitute approximately half of the biopharmaceutical market. The success of a therapeutic antibody solely depends upon its clinical efficacy. Maximized efficacy reduces the required dose of a drug during a treatment, which eventually reduces the cost of the treatment. It has been revealed in various studies that fucosylation plays a major role in imparting therapeutic importance. Non-fucosylated antibody glycans are found to be more effective compared to fucosylated glycans because of their enhanced Antibody-dependent cellular cytotoxicity (ADCC). The degree of fucosylation in the glycans can be controlled for further therapeutic research.
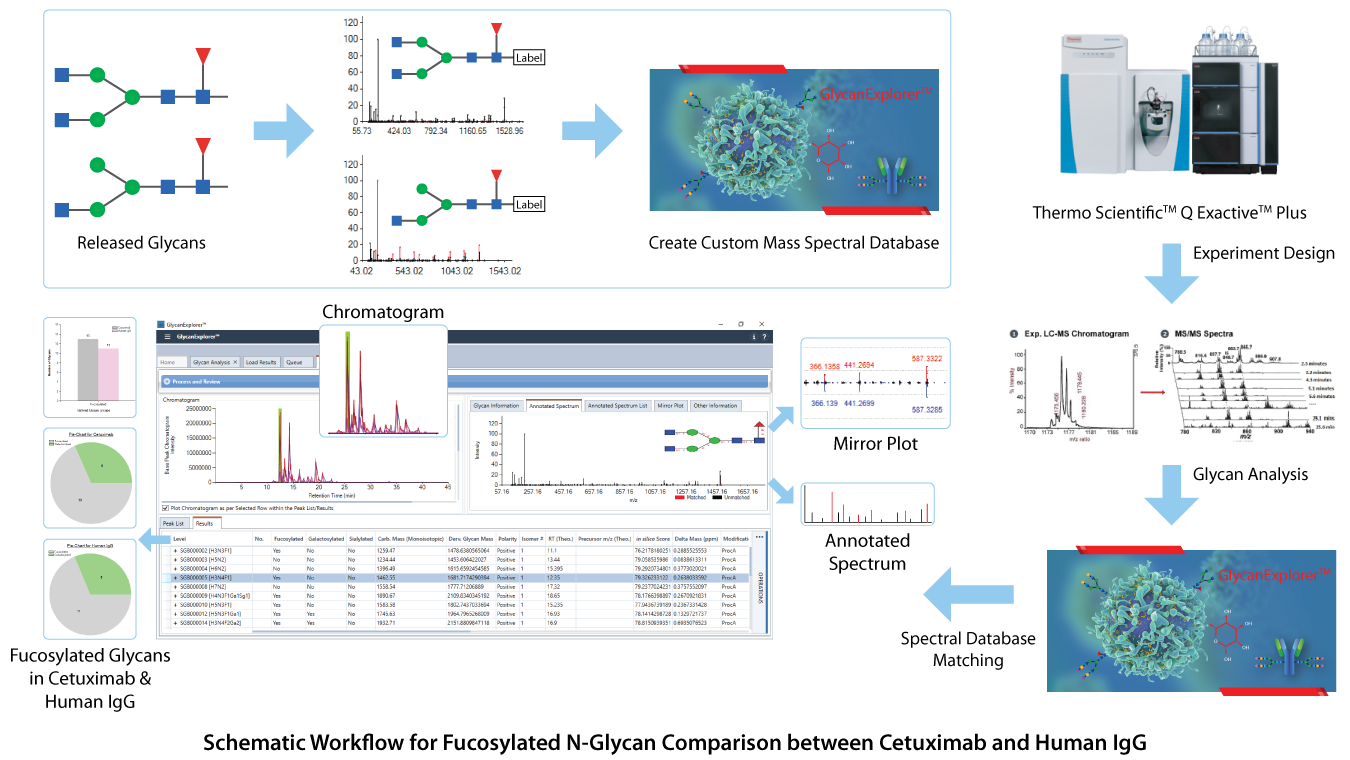
Although controlling the degree of fucosylation is beyond the scope, we used GlycanExplorerTM software to study the fucosylation in Cetuximab and Human IgG N-glycans. Cetuximab and Human IgG (hIgG) samples, each with four technical replicates were acquired using Thermo Fisher Q Exactive Plus mass spectrometer and were imported in GlycanExplorer. Using the robust LC-MS peak picking algorithm of the software, we created candidate peak lists from all the raw files using their MS1 and MS/MS data. The detected compounds were aligned across all sample-wise replicates to detect the universally observed compounds. The software provides an extensive experiment design module, where a group named "Fucosylated" was created to classify the probable glycan structures based on the core fucosylation. The detected LC compounds were then subjected to MS/MS in silico and HRAM glycan spectral database search using 10 ppm precursor and product ion tolerances. The software identified the probable glycan structures and classified them as fucosylated / afucosylated. The statistical visualization such as bar chart and pie chart helped in comparing the number of fucosylated glycans in both Cetuximab and hIgG samples which may be useful for further therapeutic research. A schematic workflow for this comparative analysis is present below:

| Comment | Share |
|


