Mass Spectra Annotation with Identified Lipids
SimLipid annotates mass spectra with the lipids, and fragment ions identified for MS, MS/MS as well as MSE data. This helps in interpreting mass spectra by highlighting the experimental m/z values that match those of theoretical lipid structures from the product database.
The annotated mass spectra can be adjudged/re-sized either to fit on a page or based on the area of interest. A user can zoom in/out into a specific plot location using the mouse cursor or by specifying the m/z range. Further, users can export the annotated spectra as images (in PNG and JPEG formats) that can be included in MS PowerPoint, facilitating information sharing amongst research groups.
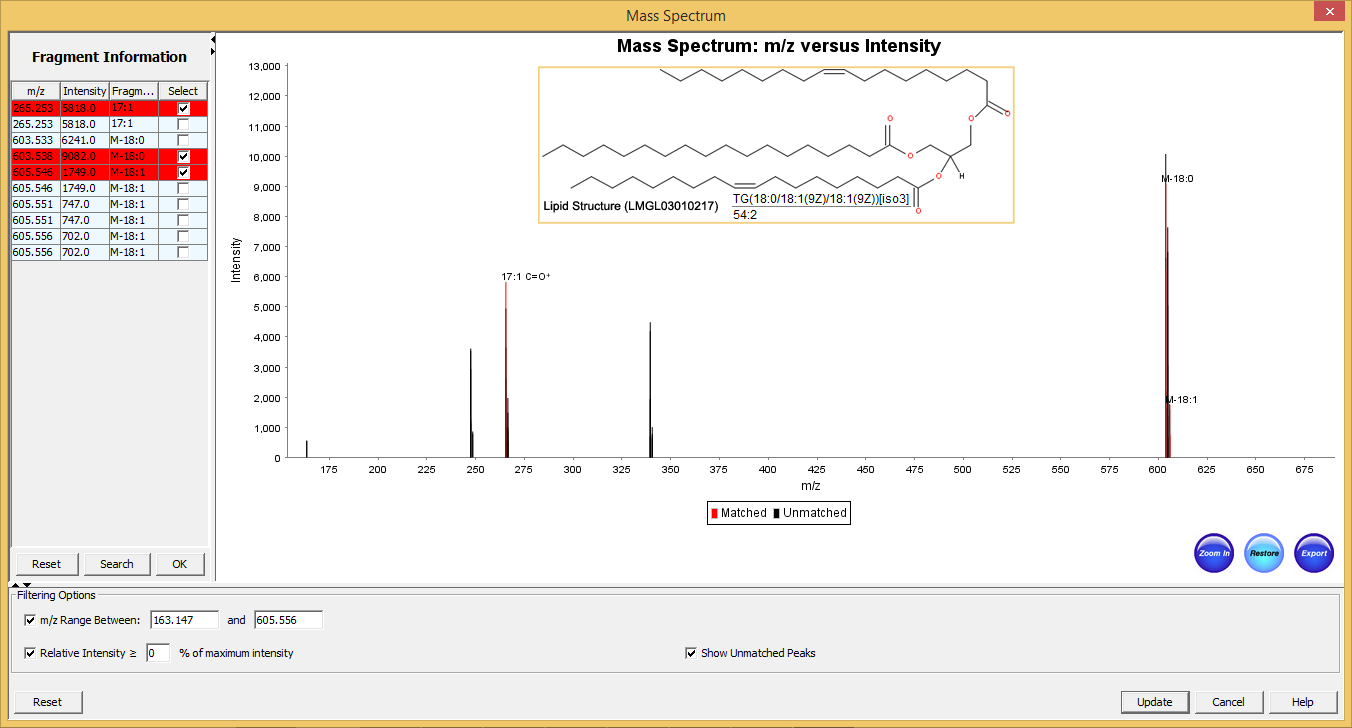
Typical graphical user interface of SimLipid software: Annotated MS/MS spectrum of the identified lipid TG(56:3). The two most intense observed peaks in the spectrum correspond to the characteristic ions of the unique fatty acid chains 18:1, and 20:1 respectively of the structure.


