Robust Lipid Structure Database
SimLipid database is a scalable relational database containing 9 lipid categories namely, Carnitines, Fatty acyls, Glycerolipids, Glycerophospholipids, Polyketides, Prenols, Saccharolipids, Sphingolipids and Sterols. The database stores 40,312 lipids, and 1,508,293 structure-specific in-silico MS/MS characteristic ions. Besides this, the database also stores 5227 transitions of precursor ion scan and neutral loss scan triple quadrupole mass spectrometry methods corresponding to 1,179, 393, and 221 unique fatty acyls from glycerophospholipids, glycerolipids, and sphingolipids respectively.
User can create custom databases* to store curated lipids along with retention times, and drift time. Once a custom database is created, MS, and MS/MS database search for structural identification of lipids can be performed using retention time, and drift time tolerances as initial search predicates. This functionality facilitates users to create LC-MS or LC-Ion Mobility-MS templates; thereby enabling them to exploit the state of the art LC-MS and IMS technologies for their research.
Other database links include Kyoto Encyclopedia of Genes and Genomes (KEGG), Human Metabolome Database (HMDB), Chemical Entities of Biological Interest (CEBI), PubChem Substance database, LIPIDBANK, and LIPIDAT. The database is continuously being updated.
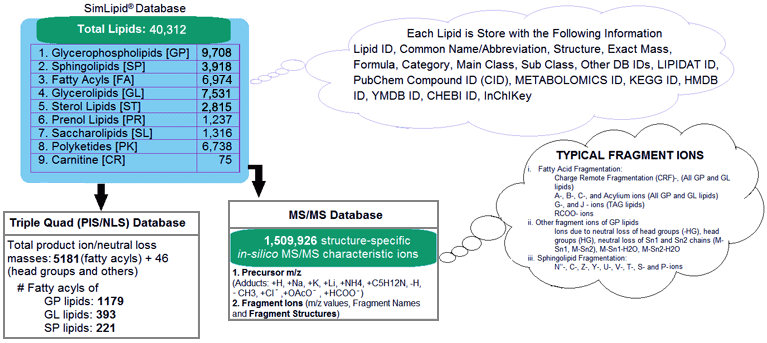
Figure 1: Schematic representation of SimLipid database.
Please Note: * The functionality is available in the Enterprise Edition of the program.
Product Info
Scientific Advisors

Dr. Vladimir Shulaev
Project Management and Data Visualization
SimLipid provides a comprehensive project management, associating lipid analysis results with input profiles and search parameters. You can create any number of projects. You can also import hundreds of raw data files in batch mode. The complete raw data from an experimental MS run: total ion chromatogram, identified lipids, MS or MS/MS spectrum, and their corresponding database information are displayed in a single workbench.
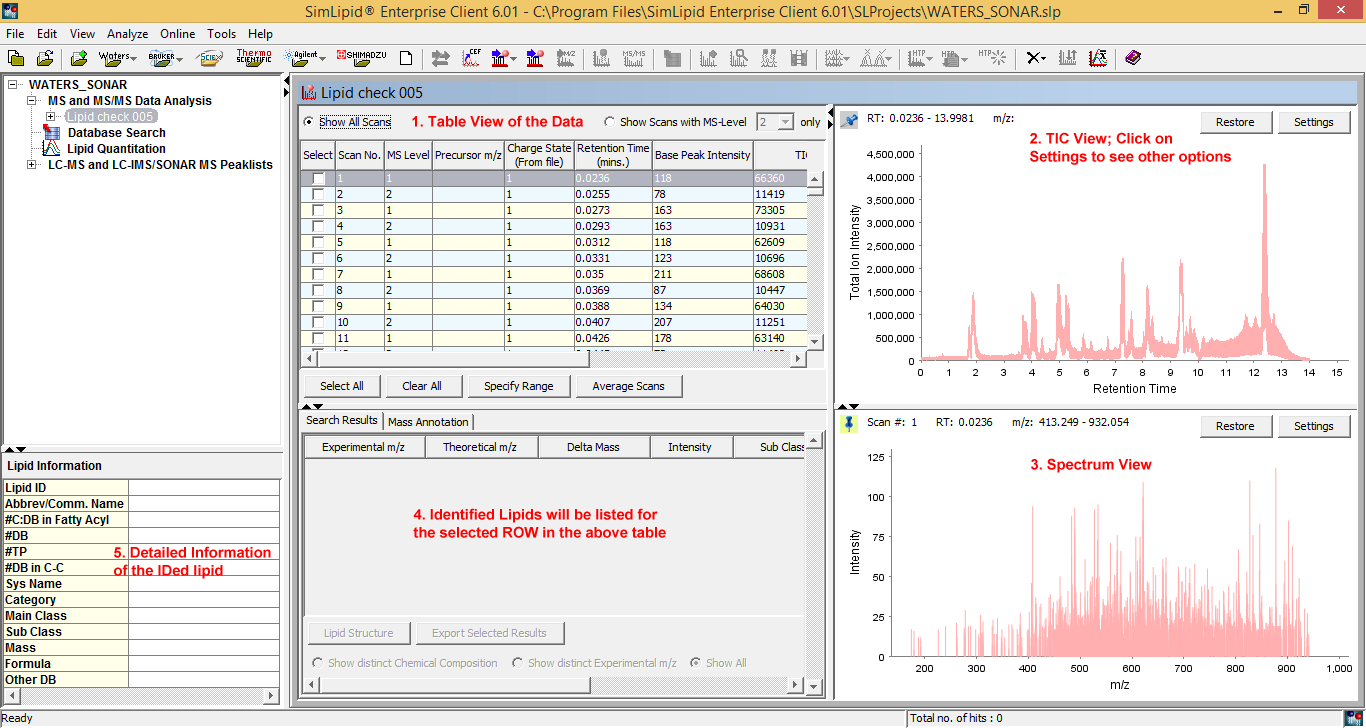
Figure 2: Typical graphical user interface of SimLipid software: A single workbench that enables you to visualize complete raw data of an LC-MS, ESI-MS, MALDI-MS experimental scan, results after performing database search, and corresponding information of an identified lipid.
SimLipid provide following additional features:
- Average MS and MS/MS scans corresponding to a specified retention time window and/or a precursor m/z range.
- Sort the loaded datasets on the basis of Precursor Ion m/z, Charge State, Retention Time, Intensity and Drift Time for the file formats supported.
- The scans/spectrum for which lipids are identified are color coded with the name/abbreviation/molecular formula of the identified lipid displayed along side.
- View extracted ion chromatogram of a target m/z.
High Throughput MS Lipid Search
SimLipid enables high throughput lipid profiling from multiple MS peak list data by searching lipid precursor ion against the known lipid structures available in the SimLipid database for Carnitines, Fatty acyls, Glycerolipids, Glycerophospholipids, Polyketides, Prenols, Saccharolipids, Sphingolipids and Sterols. Users can perform MS Lipid Search for high resolution data with an error tolerance less than or equal to 50 ppm or 2000 milliDalton (mDa). SimLipid supports [M+H], [M+NH4], [M+Na], [M+C5H12N], [M+Li] ions in the positive ion mode and [M-H], [M+AcO], [M+Cl], [M-CH3], [M+OAcO] and [M+HCOO] in the negative ion mode. Users can also trigger product ion data analysis from an MS lipid profile. The profiled lipids corresponding to a precursor m/z can be verified using product ion data for candidate lipid species.
Users can import the ion species for precursor m/z values that have been included in a high throughput search, from a predefined list of m/z values and corresponding ion species. This facilitates MS/MS search in variable ion modes and for different adducts. Multiple options are available for selecting MS and MS/MS profiles to be included in a batch run based on retention time, precursor m/z and intensity.
High Throughput Lipid Structural Elucidation using MS/MS and MSE Data
SimLipid supports structural elucidation of lipids using precursor and product ion m/z data from MS/MS and MSE spectra of Carnitines, Fatty acyls, Glycerolipids, Glycerophospholipids, Prenols, Saccharolipids, Sphingolipids and Sterols. Identified lipids are scored based on an innovative ranking algorithm that indicates the relative degree of proximity of theoretical lipids with the experimental data. High resolution accurate mass data with error tolerance between 0.001-50 parts per million (ppm) and 0.1 to 2,000 milliDaltons (mDa) can be analyzed.
Multiplexed Precursor Ion Scan (PIS) and Neutral Loss Scan (NLS) Triple Quadrupole Mass Spectrometry Methods Based Lipid Profiling and Quantitation
Data from multiple PIS/NLS can be imported into SimLipid software using either native file formats or standard formats. Users can model experimental designs in SimLipid by classifying data files according to biological/technical replicates. Identification of lipids based on target fatty acyls/head group fragment ions or their neutral losses is processed in batch mode.
SimLipid enables quantifying lipids corresponding to the peaks observed on the MS spectra. Quantification is done by normalizing the intensity values based on the observed intensity of a chosen internal standard. The program facilitates specification of endogenous/exogenous lipids as internal standards. To enable quantification of lipids from low resolution spectra, SimLipid corrects the intensities for isotopic overlaps. This facilitates accurate quantification of lipids from biological mixtures. The quantified data along with other information such as peak m/z, molecular formula, corrected, uncorrected and normalized intensities in different samples can be exported to a spreadsheet compatible .csv and .xls formats.
LC MS and LC- MS/ MS High Throughput Data Processing
SimLipid processes the LC-MS and MS/MS data for peak detection, smoothing, chromatogram deconvolution, peak deisotoping, and molecular feature finding. The program aligns detected peak m/z values to corresponding MS/MS spectra enabling seamless identification of lipid structures using precursors and product ions data from MS and MS/MS data.
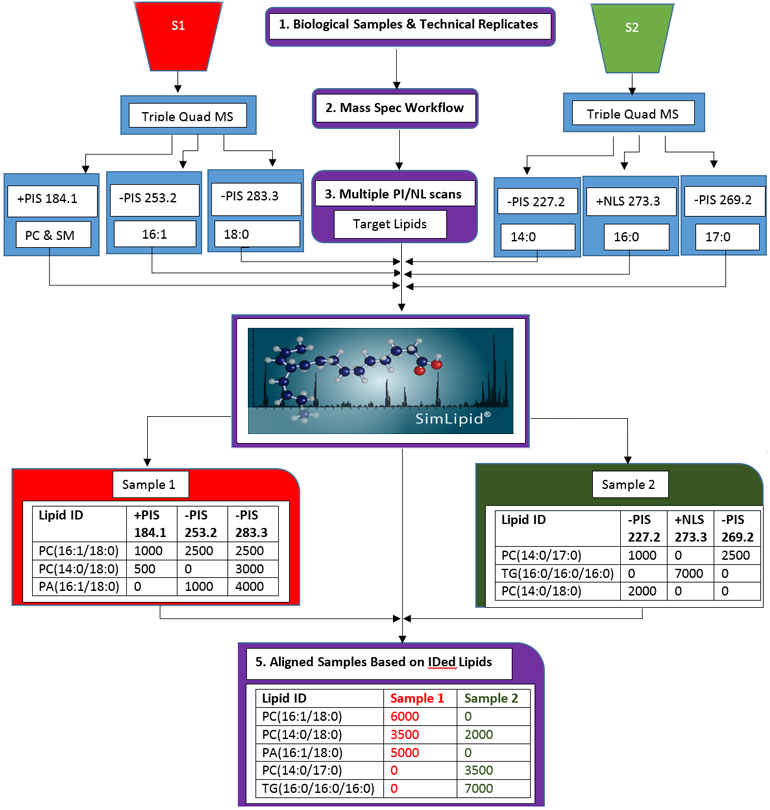
Figure 3: Schematic representation of the lipid profiling and quantitation workflow of SimLipid software using data from MPIS/NLS QqQ MS method.
SimLipid also facilitates comparative and quantitative analysis of lipids identified from different biological samples. The peaks detected from different peaklists are aligned based on the agreement of retention time, m/z value, observed intensity and charge state using the RANSAC techniques. Up to 200 peaklists can be aligned and the results can be exported to HTML, CSV and MS Excel formats.
SimLipid software provides a single workbench view of the LC-MS peaklist; list of identified lipids in the experimental LC-MS run; Structure of the identified lipid at a particular retention time; associated information of the identified lipid in the database; and total ion chromatogram with a vertical bar at the retention time of the identified lipid.
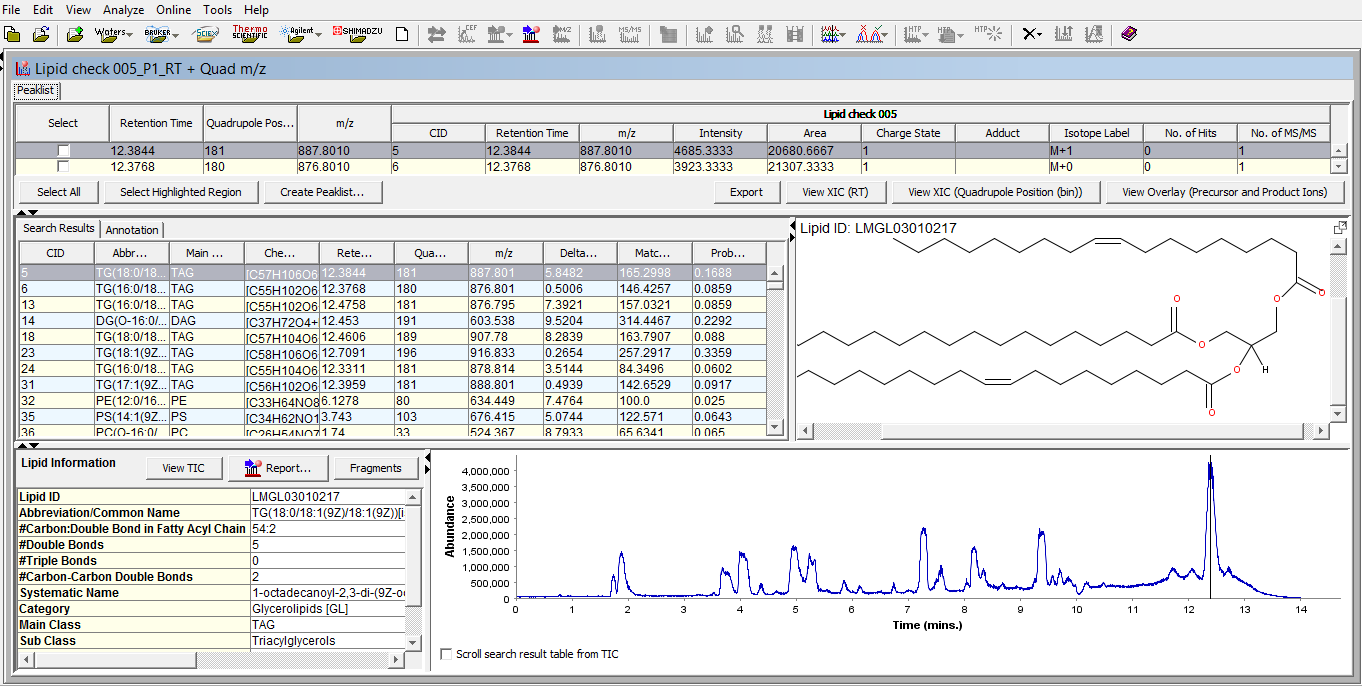
Figure 4: Typical graphical user interface of SimLipid software: A single workbench view of LC-MS peaklist, list of identified lipids at retention time points, structure of a lipid at a selected retention time point, and chromatogram of the sample with a vertical line indicating the retention time point of the displayed lipid structure.
Mass Spectra Annotation with Identified Lipids
SimLipid annotates mass spectra with the lipids, and fragment ions identified for MS, MS/MS as well as MSE data. This helps in interpreting mass spectra by highlighting the experimental m/z values that match those of theoretical lipid structures from the product database.
The annotated mass spectra can be adjudged/re-sized either to fit on a page or based on the area of interest. A user can zoom in/out into a specific plot location using the mouse cursor or by specifying the m/z range. Further, users can export the annotated spectra as images (in PNG and JPEG formats) that can be included in MS PowerPoint, facilitating information sharing amongst research groups.
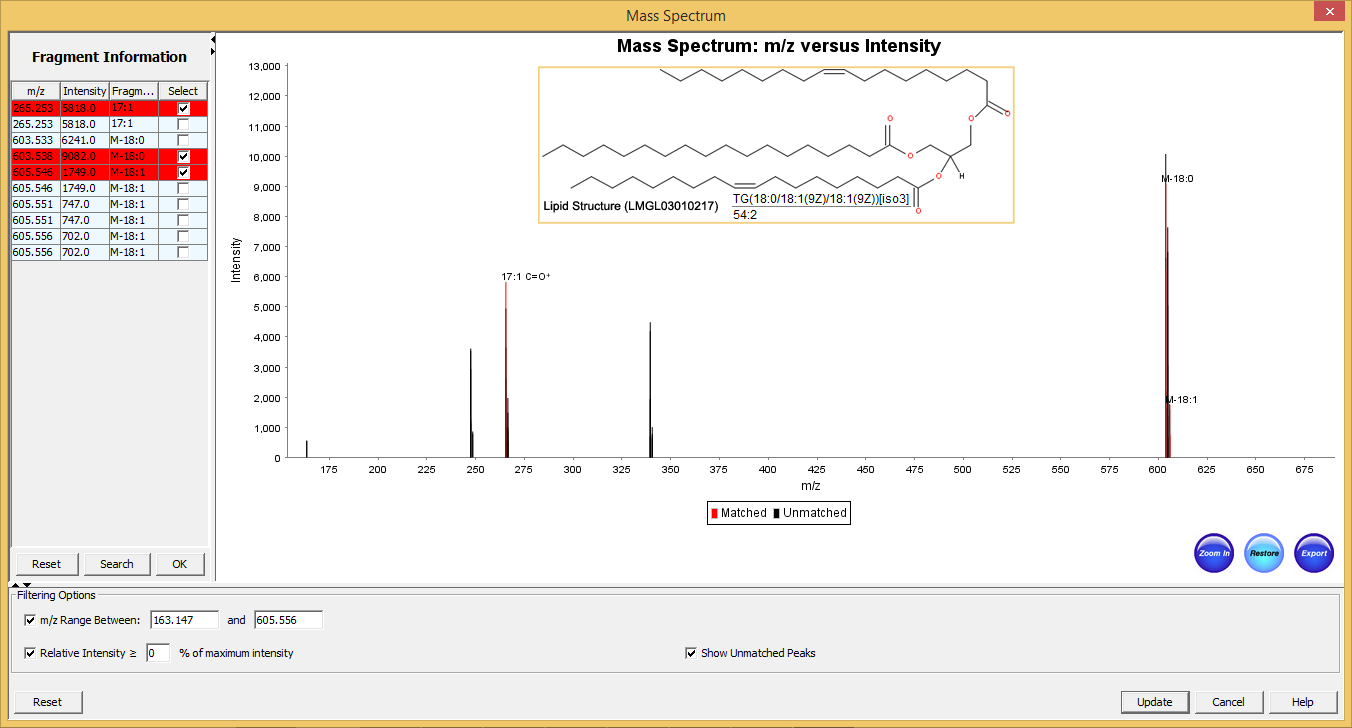
Figure 5: Typical graphical user interface of SimLipid software: Annotated MS/MS spectrum of the identified lipid TG(56:3). The two most intense observed peaks in the spectrum correspond to the characteristic ions of the unique fatty acid chains 18:1, and 20:1 respectively of the structure.
Generate Report
After analyzing mass spectrometric data, users can generate goal-oriented reports in HTML, csv and MS Excel formats from 50,000 MS and MS/MS profiles. Users can set SimLipid to launch the report automatically after performing the analysis. The reports that can be generated are for:
- Profiled MS Spectra: A comparative analysis of the abundance of profiled lipids present in different biological samples can be generated for biomarker studies.
- MS and MS/MS Data: The report displays the false positives corresponding to a precursor m/z value that are usually encountered in an MS search and the probabilistic score of lipids identified during a product ion data analysis. Such a report is generated by combining an MS lipid profile and its complementary MS/MS or MSE lipid profiles.
- Multiple Data Sets: A report containing a comparative analysis of the lipids profiled from different MS or MS/MS spectra acquired in different ion modes and adducts.
- Retention Time: This report enables users to investigate the fragment ions observed in MS/MS spectra acquired in variable ion modes by aligning the MS/MS profiles based on retention time. This provides a complete work flow solution to identify the structure of unknown lipids that belong to categories such as GP, SP, GL etc. where diagnostic ions corresponding to fatty acid chains are observed in negative spectra while those corresponding to head group are observed in positive ion spectra.
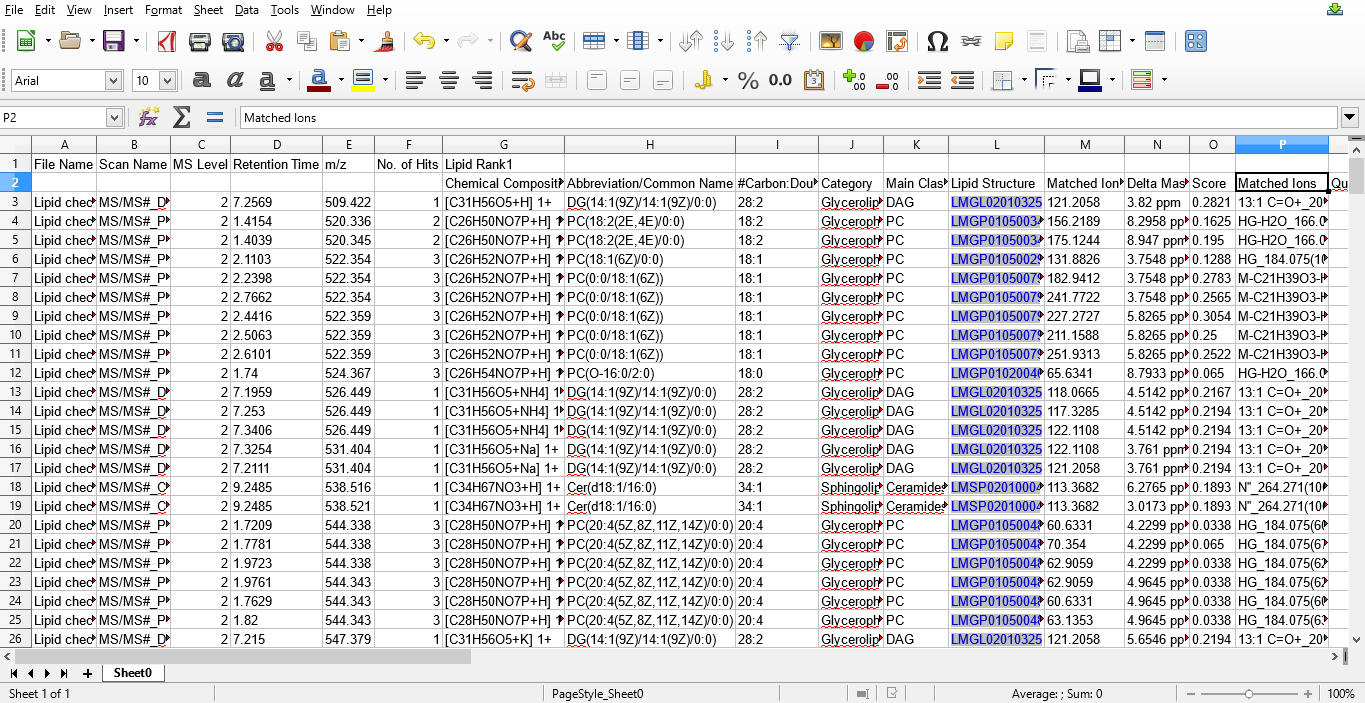
Figure 6: Lipids identified using MS/MS data exported into a MS excel file.
Database Search
You can also search for a lipid structure of interest by lipid abbreviation/common name, mass, chemical composition or lipid ID.


