Robust Glycan and Glycopeptide Database
SimGlycan database is a large relational database containing 9,964 glycans, 22,814 glycoproteins*, 6,826 glycans with known biological sources and 5,874 glycans with known classes. The database is continuously updated as information on additional glycans is published.
*The glycoproteins have been curated from The UniProt Consortium.
UniProt: A hub for protein information
Nucleic Acids Res. 43: D204-D212 (2015)

Tutorial: Create glycan template for targeted glycomics analysis using SimGlycan
Curated Database: N-Glycans of a Recombinant Human Erythropoietin (rhEPO) Expressed by a Chinese hamster Ovary (CHO) Cell Lines
Support for MALDI MS/MS and LC-MS/MS Workflows
With comprehensive support for different adducts such as H, Li, Na, Mg2+, K, HCOO- and NH4+ and adduct combinations such as Na + H, Li + H etc. along with scalable MS/MS fragmentation patterns based on different instrument settings, SimGlycan can analyze MALDI – and LC- MS/MS data for glycopeptides and released glycans that are underivatized, permethylated and reducing end modified with no compromise on the results of the analysis.
Data Input File Formats
SimGlycan allows direct automatic loading of input data files generated by mass spectrometers from SCIEX (TripleTOF™ 5600 System, TOF/TOF 5800, 4800 Plus MALDI TOF/TOF™ Analyzer, 4000 QTRAP® and QSTAR® Elite Systems), Agilent Technologies (Agilent 6200 Series TOF LC/MS and Agilent 6500 Series Q-TOF LC/MS systems), Bruker Corporation (ultrafleXtreme™ MALDI TOF/TOF, ultraflex™ MALDI TOF/TOF, autoflex™ TOF and TOF/TOF, maXis™ UHR-TOF, micrOTOF™, micrOTOF-Q™, solariX™ Qq-FTMS, and amaZon™ ion trap series), Thermo Scientific™ (LTQ FT Ultra, LTQ Velos, LTQ XL, LTQ Orbitrap Discovery, LTQ Orbitrap Velos, LTQ Orbitrap XL, MALDI LTQ Orbitrap, Orbitrap Elite, Q Exactive and Thermo Scientific™ Orbitrap™ Fusion™ Tribrid mass spectrometer and Thermo Scientific™ Q Exactive™ hybrid quadrupole-Orbitrap mass spectrometer) and Waters Corporation (SYNAPT G2 HDMS, SYNAPT G2 MS, Xevo G2 QTof, Xevo QTof MS, Xevo TQ MS and Xevo TQ-S platforms). Other mass spectrometers are supported using mzData and mzXML formats. Besides, manual entry, TXT and XLS file formats are also accepted by SimGlycan. No matter what make your instrument is, the output can be converted to these formats using third party tools.
Product Info
Scientific Advisors

Dr. Michael Tiemeyer
TMT Quantitation*
SimGlycan now supports the Mass Spectrometry-based quantitative glycomics workflow using aminoxyTandem Mass Tags (TMT). aminoxyTMT6 reagents enable efficient relative quantitation of glycans, improving labeled-glycan ionization efficiency thereby increasing analytical throughput. Glycans are quantified by measuring reporter ion peak intensities from the corresponding MS/MS spectra. User can specify a tolerance as small as 0.0001. Following extraction of peak intensities, the aminoxyTMT reporter ion signals are adjusted to account for isotopic impurities in each TMT variant. Users can select the sum/average/median reporter ion intensities across all glycan-spectral matches as the quantity of a glycan. Various charts such as bar chart, dot-plot etc. are plotted to facilitate visualization of the quantity of each glycan in different TMT channels and across biological samples.
Multi Stage Mass Spectrometry (MSn) Data Analysis
SimGlycan includes comprehensive support to perform Multi Stage/Sequential Mass Spectrometry (MSn) data analysis. MSn, a technique wherein the product ions from MS/MS (or previous stage MS) are subjected to refragmentation, is one of the most effective techniques in resolving heterogeneity, branching pattern and isobaric oligosaccharide structures. It allows discrimination of glycans having similar characteristic fragment patterns which are otherwise indistinguishable in MS/MS spectra. As the level of MS (n) increases, generated fragments become structure specific which assists in resolving isobaric oligosaccharides or detailed characterization of selected structures.
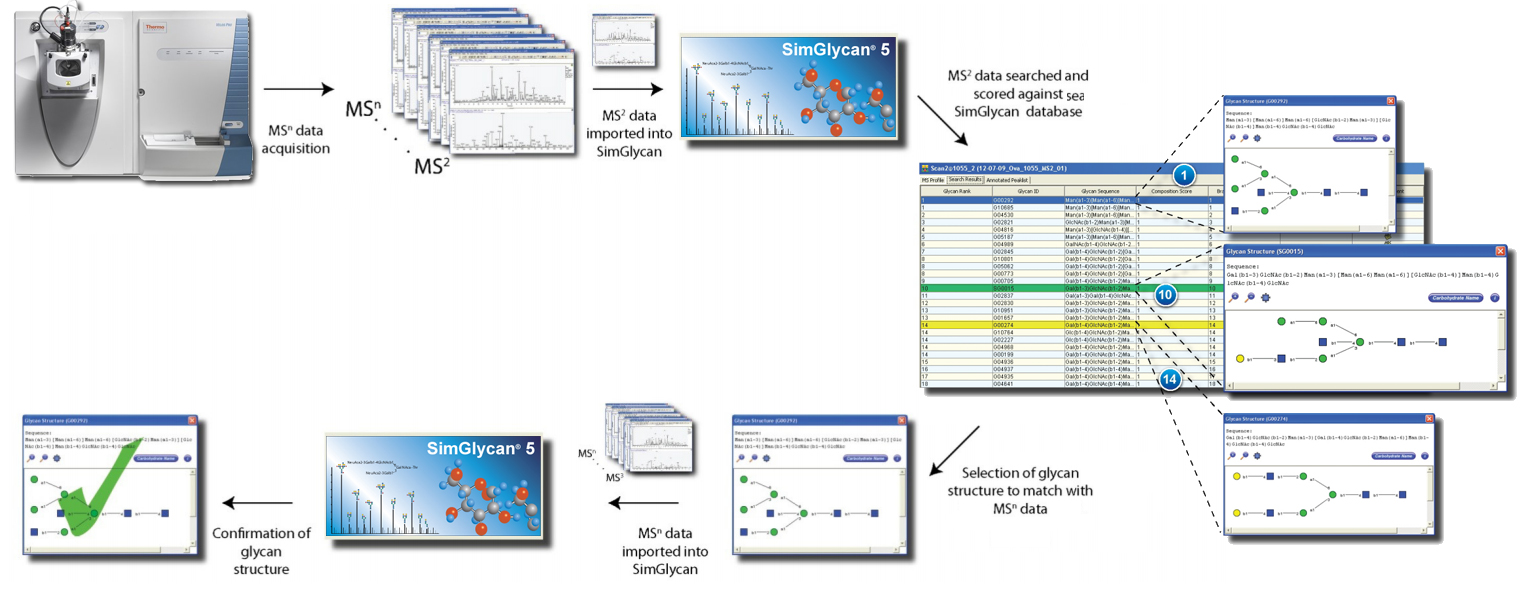
Glycopeptide Qualitative Analysis
Many of the mass spectrometers allows the capture of MS/MS data as compounds elute from in line separation systems. Such LC-MS/MS approaches generate extremely large datasets, requiring sophisticated informatics tool to assign glycopeptide structures over a complete chromatographic separation. This would enhance analytic productivity and provide greater depth of analysis of mass spectrometric glycoproteomic data. SimGlycan now includes comprehensive support for identifying glycopeptides of complex mixtures separated by LC and detected by MS/MS in batch processing mode. The Protein ID, Protein sequence or Peptide sequences identified by using a third party tool will be used by SimGlycan as initial input. SimGlycan identifies probable glycan-peptide combinations and ranks them on the basis of observed peaks in the MS/MS data corresponding to diagnostic ions from theoretical glycopeptide. High resolution accurate mass data with an error tolerance between 1 to 20 parts per million (ppm) and 0.1 to 2000 milli Dalton (mDa) can be analyzed.
Project Management
SimGlycan provides a comprehensive project management, associating results with input profile and search parameters. You can open any number of projects. Users can import 20,000 spectra in a project. The projects can be classified on the basis of the source, the lab or the research goal. This is important, especially when conducting large-scale glycan analysis projects. You can access glycan related information at the click of a button. Unlike web based applications, SimGlycan saves it on your own computer.
The available information consists of:
Glycan Structure: Displays the molecular structure (carbohydrate sequence) of the glycan.
Glycan Fragments: Displays the nomenclature, structure, m/z value and mass using Domon Costello rules of fragmentation. A serial number is assigned to each fragment.
i) Glycosidic Fragments: Single glycosidic and glycosidic/glycosidic fragments are displayed.
ii) Cross Ring Fragments: Single cross ring and glycosidic/cross ring fragments are displayed.
Glycopeptide Structure: Displays the peptide sequence and the sites of protein glycosylation along with the glycan structures.
Annotate Mass Spectra and Generate Reports: SimGlycan can annotate mass spectra using cartoons or Domon-Costello nomenclature. The charge state of the fragment is also depicted. Read more...
Export Annotated Peaklist Table: Users can export annotated peaklist for all search results from 20,000 MS/MS spectra to single project report. Users can include either only the matched fragments or both matched and unmatched fragments in the annotated peaklist table.
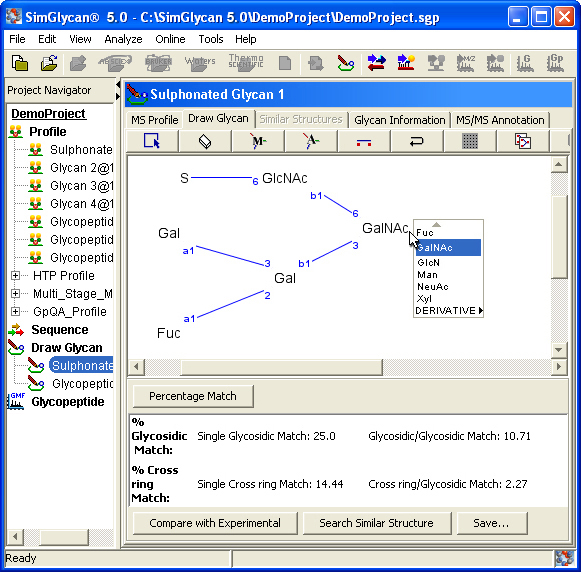
Draw Glycans
SimGlycan enables users to draw and edit glycan and glycopeptide structures. A monosaccharide, peptide chain or a substituent such as HSO3, Etn can be added or deleted and branching points and anomeric linkages can be modified at the click of a button. At each step, the fragmentation of the drawn structure enables a user to compare the experimental and theoretical data, enabling the user to see whether his modification brings the theoretical glycan closer to the experimental data. This feature greatly assists in resolving glycan structures, especially when data for glycans of interest is not yet available.
Mass Spectra Interpretation
Software helps in interpreting a mass spectra by highlighting the experimental m/z values that match those of theoretical fragments and generates an annotated spectrum depicting the loss of consecutive monosaccharide units. This helps researcher to establish the branching pattern and verifying the basic unit of glycan. Each peak can be represented using cartoons or Domon Costello nomenclature. Charge states of fragments are also displayed if the fragments are multiply charged.
SimGlycan enables generating an annotated mass spectra either to fit on a page or based on the area of interest. It also exports it for sharing the findings with your colleagues.
The simple interface enables you to zoom into specific plot locations, specify m/z range to display specific plot sections and also to export plots as image files to MS PowerPoint, for publishing results and sharing information with colleagues.
Cartoons are constructed using standard Consortium for Functional Glycomics (CFG) nomenclature for monosaccharides (custom symbols are used where CFG annotations are not available). You can simultaneously plot all types of glycosidic fragments while annotating the spectra in symbolic representation format.
*This feature is available in the SimGlycan Enterprise Edition.


